|
When conducting an air dispersion modeling analysis, the ability to present high-quality graphical depictions of the output is extremely important. Such images provide context to modeled results, and they provide a valuable tool to modelers in understanding and explaining the model’s calculations.
Lakes Software’s wide range of air quality modeling products – such as AERMOD View, CALPUFF View, and more – all feature easy-to-use graphical tools and options so users can customize each project’s output display to suit their needs. These options can be accessed via the Graphical Options button on the main toolbar or a button in the Annotation Toolbar.

Graphical Options in AERMOD View

Annotation Toolbar
Graphical Options cover a wide range of settings including:
- Contour depiction for model output and terrain elevations;
- Define the axis labels, scale, and display of the model domain;
- Set colors of individual objects
- Choose how object labels are placed and how they look;
- And more!
When contours are plotted in Lakes’ commercial software products, the applications automatically set the levels based on the data distribution presented by the model. For example, concentration contours are set using the maximum modeled concentration as the highest level and the minimum non-zero concentration as the lowest level. This can result in contours which cover almost the entire display.
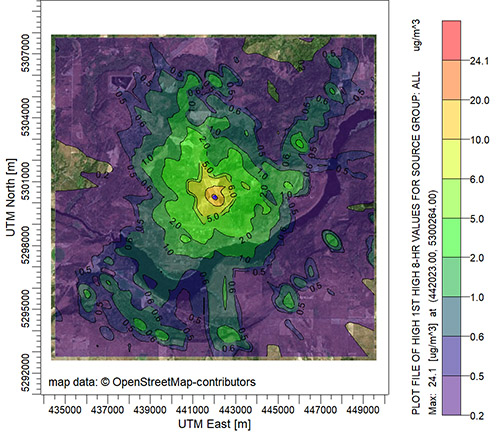
Sample AERMOD Model Output with Default Contour Settings
Users may only want to display contours above a certain threshold. Alternatively, the modeler may wish to hide some low level contours so a large portion of the modeling domain is shown in the display.
The Use Cut Off option in Lakes’ Graphical Options is an easy way to achieve this.
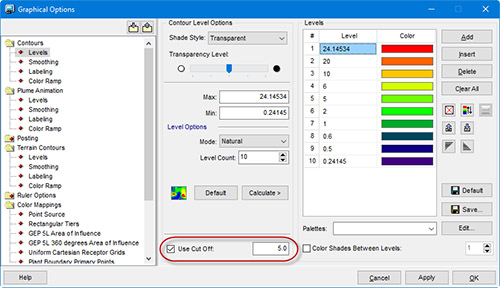
AERMOD View Graphical Options
With the Use Cut Off option enabled, all contours below the specified numeric value will be made completely transparent. This allows users to quickly hide low contour values without having to completely change the default contour levels.
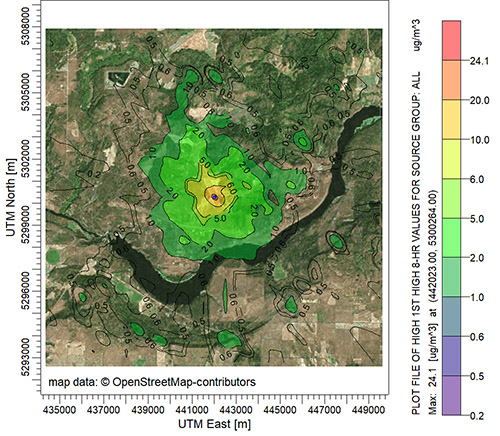
Sample AERMOD Model Output with 1 µg/m3 Cut Off Applied
In the example above, applying the Cut Off allows more of the satellite imagery in the modeling domain to be displayed thus providing context to the higher modeled concentrations. The Cut Off option can also be applied to other settings such as Terrain Contours where high elevations can be emphasized. In the example below, the Terrain Contours Cut Off was set to show only contours above the height of the tallest stack in the project (i.e., complex terrain).
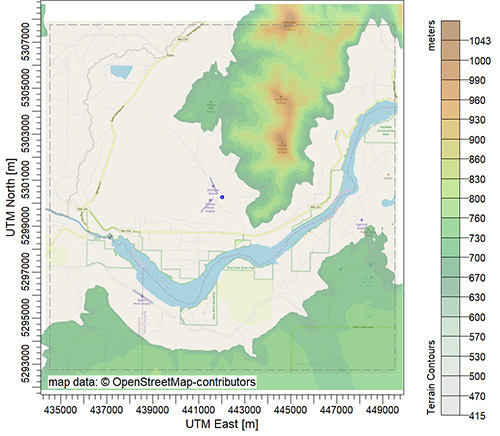
Terrain Contours with Cut Off Applied
Using the Cut Off option is one small way users can easily customize their plots to create meaningful depictions of their projects.
|


