|
The AERSCREEN model estimates worst-case impacts of ground-level concentrations for a single source by interfacing with the screening mode built into the AERMOD executable. AERSCREEN produces several different output files which can be assessed and analyzed using the advanced output viewer of Lakes Software’s AERSCREEN View application.

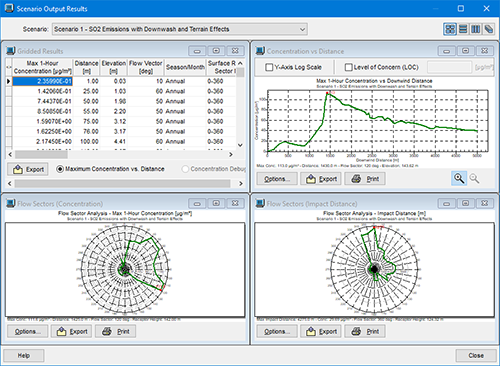
AERSCREEN View’s Scenario Output Results Viewer
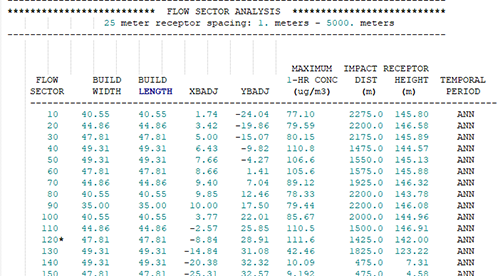
For screening assessments that include a direction dependency – such as those involving complex terrain, building downwash, or rectangular area sources – AERSCREEN calculates results along 10° wind sectors. Automated receptor arrays are built along each wind sector based on the user-defined minimum ambient distance and maximum probe distance values. By default, receptors are placed at 25-meter increments out to 5 km from the source.
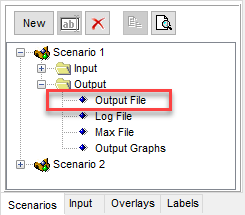
The results calculated along these arrays are printed to the main Output File which can be viewed in AERSCREEN View by double-clicking the name from the Scenarios Tree View.

AERSCREEN View Scenarios Tree View

Example Flow Sector Analysis Output
After completing the flow sector analysis, AERSCREEN enters a refined mode which analyzes receptors at 5m, 2m, & 1m resolutions along the worse-case flow sector to pinpoint the maximum 1-hour concentration for the modeled scenario.
Results from both the Flow Sector Analysis and the refinement process are tabulated in the Gridded Results display of AERSCREEN View’s Scenario Output Results window.
Each of AERSCREEN View’s graphs can be customized by selecting the Options button. You can modify the titles, plot style, colors, fonts, and more!
|


