|
Previous Modeling Tips have covered different aspects of identifying plant boundaries in an AERMOD View project. This modeling tip describes plant boundary visualization capabilities and the ability to separate onsite and offsite impacts.
A new feature in AERMOD View now allows users to easily locate modeled results along the boundary line – Plant Boundary Reports. These new reports don’t even require any special updates to your projects (new or existing).
The only requirement is that the project include a Plant Boundary. This can be drawn by hand using the Plant Boundary Tool or imported via the Receptor Pathway | Fenceline inputs.

Plant Boundary Tool
After the model has been run, access reports via the Reports tool button along the main menu.

You can choose from 2 different report types:
- Plant Boundary Summary reports concentrations at all selected receptors along the boundary according to the output options selected.
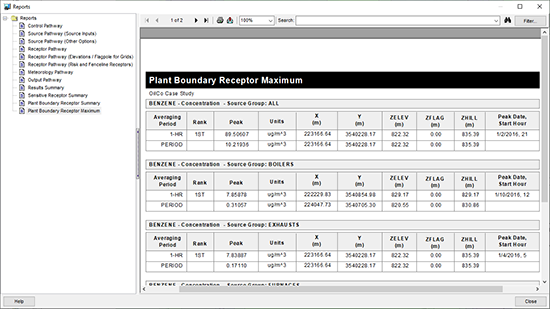
- Plant Boundary Maximum reports only the maximum concentrations from the selected receptors along the boundary.
Both reports can be filtered to display Primary, Intermediate, or all boundary receptors, and the results can be filtered by Source Group as well. Results are presented for any high values identified in the project’s Output Pathway.

Sample Plant Boundary Maximum Report
|


