|
In 2010, the United States Environmental Protection Agency (U.S. EPA) revised the National Ambient Air Quality Standards (NAAQS) for short-term nitrogen dioxide (NO2) and sulfur dioxide (SO2). Due to the unique forms of these standards – which are based on annual distributions of daily maximum hourly concentrations as opposed to the distribution of all hourly values – the AERMOD air dispersion model had to be updated to perform calculations accordingly.
Nearly 15 years later, AERMOD continues to perform both NAAQS and non-NAAQS calculation methods. Understanding how to employ these very different calculation methods can lead to confusion, however. Lakes Environmental’s AERMOD View reduces modeler confusion by clearly presenting the model’s 1-hour averaging options.
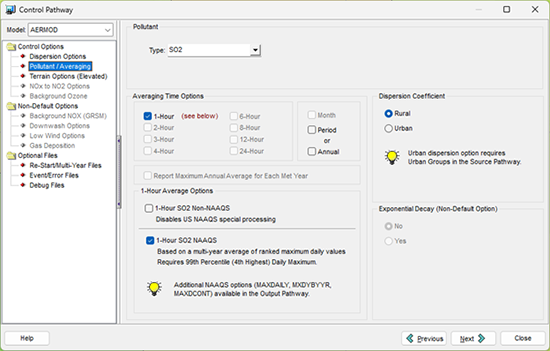
In AERMOD View’s Control Pathway settings, modelers will find the Pollutant/Averaging options. This is one of the main controls of an AERMOD project as the selections made here will drive the calculation methods employed within AERMOD’s code.

AERMOD View’s Pollutant/Averaging Display
When the following settings are enabled, AERMOD will automatically enable the special NAAQS processing routines:
- Pollutant Type: Set to NO2 or SO2
- Averaging Time: The 1-Hour selection can be the only selected short-term averaging period
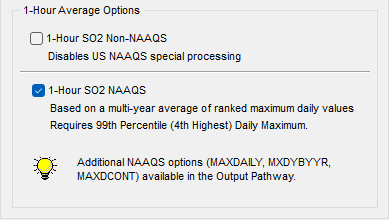
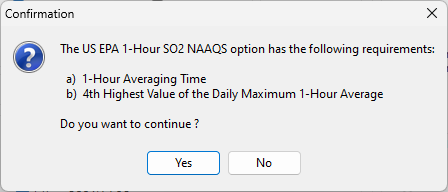
Lakes Environmental included the 1-Hour Average Options to clarify which mode AERMOD will use. Users who want to continue with their project to calculate 1-hour NO2 or SO2 NAAQS runs should select the 1-Hour NO2/SO2 NAAQS checkbox. An additional confirmation dialog will appear to confirm the selection.


For modelers who want to calculate hourly NO2 or SO2 impacts separate from this NAAQS assessment, the 1-Hour NO2/SO2 Non-NAAQS selection will disable the US NAAQS processing routines.
Output Differences:
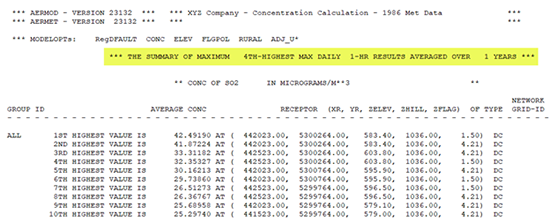
Making the proper averaging period selections is crucial because output from these methods can be very different.
With NAAQS processing enabled, the model tracks the maximum daily 1-hour average for each desired high value and averages those values across the number of years being processed. The output tables in the AERMOD output file will report results as “The Summary of Maximum nth Highest Max Daily 1-HR Results Averaged Over y Years” where n is the user-specified high value (typically 4th highest for SO2 and 8th highest for NO2) and y is the number of years processed in the model run.

With Non-NAAQS processing enabled, results are reported as “The Summary of Highest 1-HR Results” with no averaging done across multiple years and no maximum daily distribution performed by the model.

|
