|
The AERMOD modeling system contains many flexible output options so users can define the types of output that will work best for their unique situations. Despite this flexibility, some components of AERMOD’s code are limited to specific units or file types. For example, users can modify the default emission & output units but these units are still mass-based.
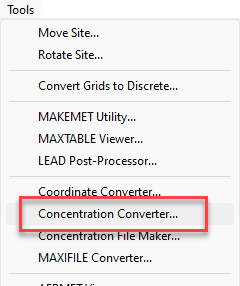
To provide users with additional flexibility and customization, AERMOD View contains a Concentration Converter utility. Found in the Tools menu, the Concentration Converter generates new contour plot output files via multiple methods for converting data from existing model output.

Tools Menu

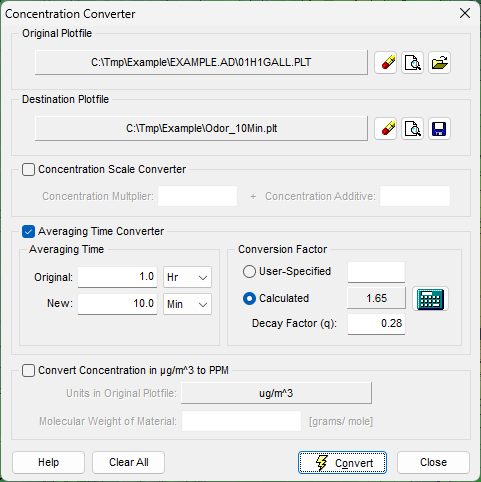
Concentration Converter Utility
First, open a contour plot file from your original model run in the “Original Plotfile” field. Next, click the Save icon next to the “Destination Plotfile” field and assign a name to the file that will contain the converted output.
The utility features three conversion methods:
1. Concentration Scale
Select this option to apply a multiplicative and/or an additive factor to the modeled concentrations. This method applies the linear transformation equation (y = [m * x] + b), and it is useful for scaling existing output without performing a full model run.
2. Averaging Time
Convert model output from a model-defined averaging period to a new period. This is most commonly employed for estimating sub-hourly averages using 1-hour average model output (which represents the minimum allowable time step in AERMOD). This option requires definition of a User-Specified conversion factor or Decay Factor. The following equation is then applied:
Cnew = Cold (Told / Tnew)q where:
Cnew = Converted concentration
Cold = Original modeled concentration
Tnew = New averaging period
Told = Original averaging period
q = Decay factor (values for q vary, please contact your regulator for guidance)
3. Unit Conversion
Another use for this utility is to convert model output to parts per million. This can make reporting values easier since air quality standards often refer to values in parts per million. This option applies the following equation:
Cppm = Cµg/m**3 x 0.02445 / MW where:
Cppm = Concentration of the contaminant
Cµg/m**3 = Modeled concentration in µg/m**3
MW = Molecular weight of contaminant
0.02445 = Constant representing the volume, in liters, of one mole of a gas at standard temperature (25°C) and pressure (1 atmosphere).
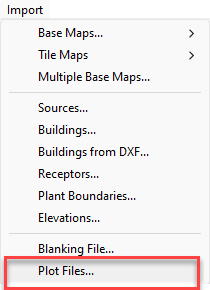
After supplying the required inputs for the desired conversion method, press the  button to generate the converted contour plot. To visualize the new data, go to the Import menu and select the Plot Files option. Select the file in the location you saved it from the utility’s Destination Plotfile field. button to generate the converted contour plot. To visualize the new data, go to the Import menu and select the Plot Files option. Select the file in the location you saved it from the utility’s Destination Plotfile field.


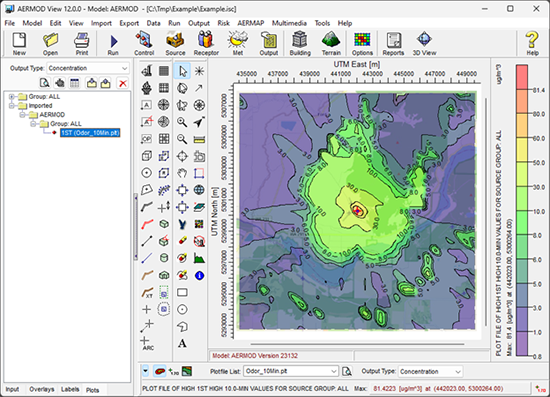
Example display of a 10-minute average contour plot
|
